The Promised Trillion Dollar AI-Coding Market
Who projects a trillion-dollar market for AI coding, what each projection counts, and what every projection assumes about energy, tokens and reuse.
David Charlot, Open Interface Engineering
Research studies, not journal finals. Notation is defined in the paper. Analytical energy estimates are not board power. Interactive figures live under /living/. Shared terms: glossary.
Cite this
Genre: Economics essay
David Charlot, Open Interface Engineering. The Promised Trillion Dollar AI-Coding Market. Open Interface Engineering. Web: https://research.openie.dev/papers/ai-coding-market/. PDF: https://research.openie.dev/pdfs/ai-coding-market.pdf.
The Promised Trillion Dollar AI-Coding Market
Version 1.1, 11 October 2026. Data and code: research.openie.dev/data/. LaTeX PDF: /pdfs/latex/ai-coding-market.pdf (source).
Abstract
Forecasts say AI coding will be worth trillions of dollars a year. This essay lists who says so, labels each number by what it is, and names the assumptions the forecasts share.
In plain words
- The big numbers about AI coding are mostly guesses about the future, not counts of money already earned.
- Almost all of them assume that every new piece of code needs a large AI model, paid by the word, forever.
- If working code can be saved and reused, the cost of a repeated job falls toward the cost of the electricity to run it, and those forecasts would be too high.
1. Projections and measurements are different objects
Every number below carries one of five labels.
| Label | Meaning |
|---|---|
| Projection | A forecast or a value estimate built on stated assumptions |
| Company-reported | A figure a company states about itself, such as annualized run-rate revenue (the latest month times twelve) or a funding valuation |
| Survey estimate | A market-sizing figure from a survey of buyers |
| Filed | A figure in a regulatory filing |
| Measured | A count or an energy reading from a run whose artifacts are kept. Energy readings carry one of three labels: est_j for an analytical estimate, reported_j for an operating system or on-chip counter, measured_j for an external power meter |
Only the last row is evidence about the cost of a correct result. The others are evidence about what the market expects.
2. Who projects what
2.1 Developer value: the trillion
| Claim | Number | Label | Source |
|---|---|---|---|
| Software developers worldwide | about 30 million (27 million to 47 million by estimate) | Projection input | Appenzeller and Li [1] |
| Value per developer per year | $100,000 (assumed) | Projection input | [1] |
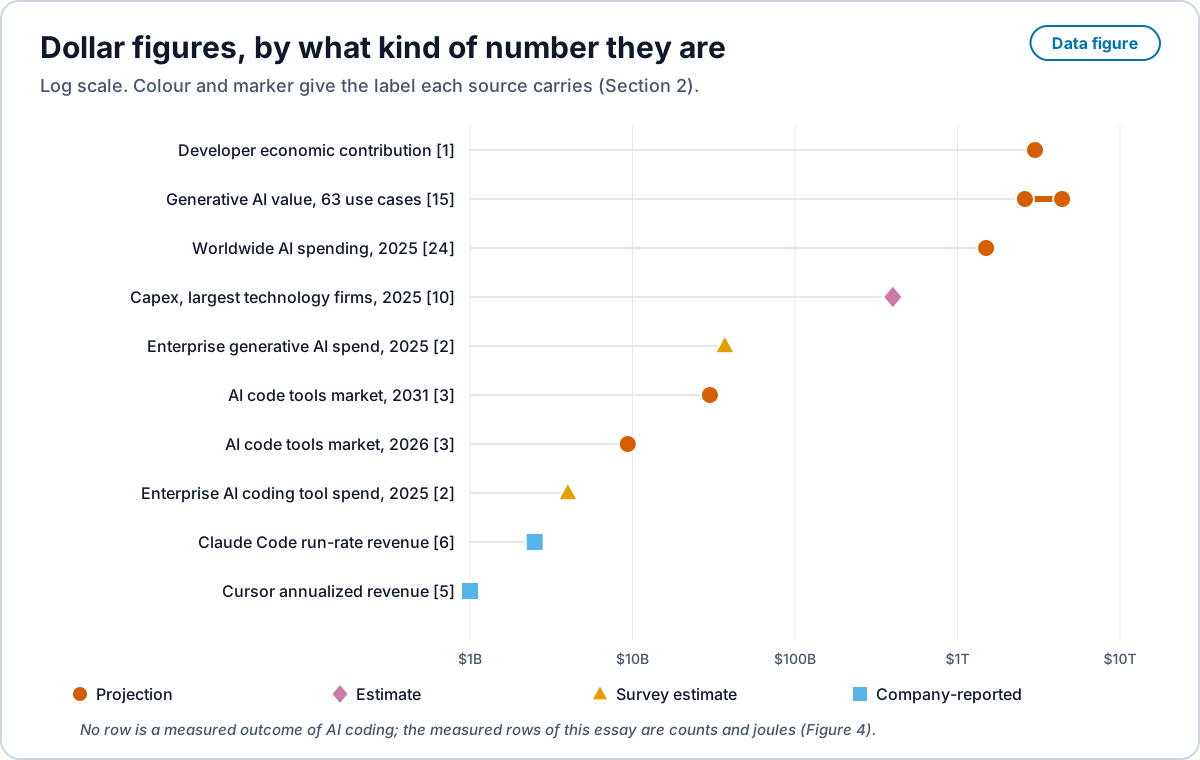
| Annual economic contribution | about $3 trillion | Projection | [1] |
| Developers on GitHub | 180 million plus; 518.7 million pull requests merged in the year | Company-reported | GitHub Octoverse 2025 [17] |
| Value of generative AI across 63 use cases | $2.6 trillion to $4.4 trillion a year; software engineering productivity 20% to 45% of current annual function spend | Projection | McKinsey [15] |
| Global GDP effect of generative AI | 7% over a ten-year period | Projection | Goldman Sachs [16] |
| Productivity gain from a simple assistant | about 20% | Estimate from interviews | [1] |
| Productivity gain from a best-of-breed deployment | “at least double” | Estimate “based on anecdotal evidence” | [1] |
The developer count is soft: 30 million is a professional estimate, and GitHub alone counts six times that many accounts that build on it [17]. The per-developer value and the productivity multiple are soft too (Section 2.7). McKinsey’s 2023 estimate is the original trillion of this market, and it is a value estimate across all functions [15]. The same venture essay says the AI coding ecosystem can “support dozens of billion-dollar companies and even a trillion-dollar giant” [1]. That sentence is the trillion. It is a value estimate. It is not a revenue forecast.
2.2 Tool revenue and enterprise spend
| Claim | Number | Label | Source |
|---|---|---|---|
| Enterprise spend on AI coding tools, 2025 | $4.0 billion, 55% of departmental AI spend | Survey estimate | Menlo Ventures [2] |
| Enterprise generative AI spend, 2025 | $37 billion | Survey estimate | [2] |
| AI code tools market, 2026 | $9.35 billion, to $29.96 billion by 2031 | Projection | Mordor Intelligence [3] |
The revenue the market reports today is in the billions. The trillion is the value the market hopes to capture.
2.3 Company revenue and valuations
| Company claim | Number | Date | Label | Source |
|---|---|---|---|---|
| Cursor annualized revenue | over $1 billion | 13 November 2025 | Company-reported | Cursor [5] |
| Cursor Pro repriced | from request limits to “$20 of frontier model usage per month at API pricing”, with refunds for the change | June to July 2025 | Company-reported | Cursor [18] |
| Cursor Series D | $2.3 billion at $29.3 billion post-money | 13 November 2025 | Company-reported | [5] |
| Anthropic run-rate revenue | $14 billion | 12 February 2026 | Company-reported | Anthropic [6] |
| Claude Code run-rate revenue | over $2.5 billion | 12 February 2026 | Company-reported | [6] |
| Anthropic Series G | $30 billion at $380 billion post-money | 12 February 2026 | Company-reported | [6] |
Anthropic states that the round funds “infrastructure expansions” [6]. Revenue, valuation and compute are one bet.
Figure 1 sets the dollar figures of Sections 2.1 to 2.3 and 2.6 on one axis, marked by the label each source carries.
2.4 Inference, tokens and unit economics
| Claim | Number | Label | Source |
|---|---|---|---|
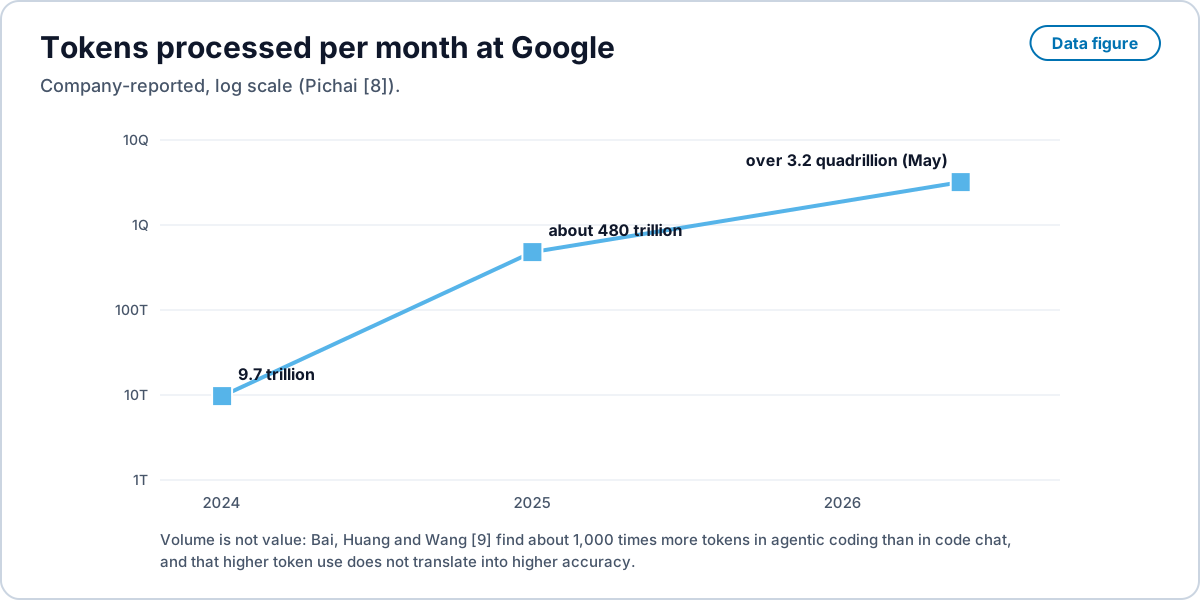
| Google tokens processed per month | 9.7 trillion (2024), about 480 trillion (2025), over 3.2 quadrillion (May 2026) | Company-reported | Pichai [8] |
| Google internal AI developer tools | half a trillion tokens a day in March 2026, more than three trillion a day in May | Company-reported | [8] |
| Cost of one agentic coding query at list prices | $2.50: a 100,000-token context and 10,000 output tokens at $15 and $75 per million tokens | Illustration | Appenzeller and Li [1] |
| The same at 3 queries an hour, 7 hours a day, 200 days | about $10,000 a year per developer | Illustration | [1] |
| Tokens in agentic coding against code reasoning and code chat | about 1,000 times more; runs of one task differ by up to 30 times; higher token use “does not translate into higher accuracy” | Measured (eight models, SWE-bench Verified) | Bai, Huang and Wang [9] |
| Net losses from Microsoft’s investment in OpenAI, quarter ended 30 September 2025 | $4.1 billion pre-tax, its equity-method share, in other expense; a $3.1 billion reduction in net income ($0.41 per diluted share) | Filed and company-reported | Microsoft Form 10-Q [7]; Microsoft FY26 Q1 performance [19] |
Two lines in the sources state the economics plainly. Pichai: “many companies are already blowing through their annual token budgets, and it’s only May” [8]. Appenzeller and Li: “For decades, software development cost was almost purely people’s cost, but now LLMs add a substantial opex component” [1].
Figure 2 plots the token series.
2.5 Price per token
| Claim | Number | Label | Source |
|---|---|---|---|
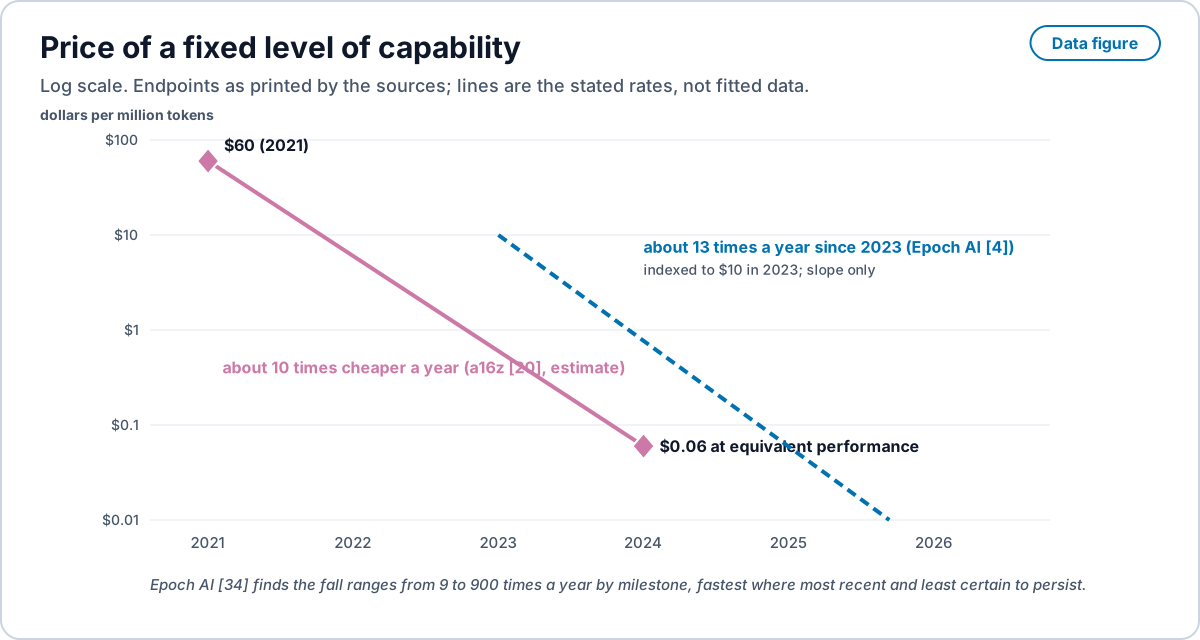
| Cost of a fixed level of AI performance | down about 47% per quarter, about 13 times per year, since 2023 | Measured price series (five benchmarks) | Epoch AI [4] |
| Price to reach a fixed benchmark score | falls 9 to 900 times a year, depending on the milestone; fastest drops most recent and least certain to persist | Measured price series (log-linear fits) | Epoch AI [34] |
| Inference cost at equivalent performance | down about 10 times a year: $60 per million tokens in 2021 to $0.06 | Estimate | Appenzeller, a16z [20] |
| DeepSeek API price cut, 29 September 2025 | developers’ cost “lowered by more than 50%” | Company-reported | DeepSeek [21] |
The 13 times a year of [4] is one point in a wide range [34]. The fall is driven by competition and open weights, as the DeepSeek cut shows [21]. It needs no energy accounting. That is the first of the two declines in Section 5. Reuse adds a different one: calls per task.
Figure 3 draws the two price series.
2.6 Energy and capital
| Claim | Number | Label | Source |
|---|---|---|---|
| Data-centre electricity, 2024 | about 415 TWh, about 1.5% of world electricity | Estimate | IEA, Energy and AI [11] |
| Data-centre electricity, 2030 | about 945 TWh, Base Case | Projection | [11] |
| Data-centre electricity, 2025 to 2030 | 485 TWh to 950 TWh, about 3% of world demand | Estimate and projection | IEA, Key Questions on Energy and AI [10] |
| Capex of the largest technology companies | over $400 billion in 2025, expected up another 75% in 2026 | Reported and projected | [10] |
| Alphabet capex | $31 billion in 2022; about $180 to $190 billion expected in 2026 | Company-reported and guidance | Pichai [8] |
| Energy per task | down by at least an order of magnitude a year; reasoning and agentic tasks use “hundreds or thousands of times more energy per query than simple text generation” | Estimate | [10] |
| One median text prompt to a production assistant | 0.24 Wh | Measured by the operator | Elsworth et al. [12] |
| Stargate | $500 billion over four years for AI infrastructure for one lab, $100 billion deployed at once | Company-announced | OpenAI [22] |
| Worldwide AI spending, 2025 | about $1.5 trillion | Projection | Gartner [24] |
| Revenue the capex must earn back | “AI’s $600B question” | Analysis | Sequoia Capital [23] |
The rent that must be serviced is hardware rent. Capex and commitments of this size are paid back through usage priced above its energy. On tasks that can be closed by reuse, that base is smaller.
2.7 Productivity evidence
| Study | n | Design | Effect | Source |
|---|---|---|---|---|
| a16z essay | interviews | Estimate | about 20% for a simple assistant; “at least double” best of breed | [1] |
| GitHub Copilot, HTTP server task | recruited developers | Controlled experiment | 55.8% faster on one toy task | Peng et al. [27] |
| Google enterprise trial | 96 engineers | Randomized controlled trial | about 21% less time on task | Paradis et al. [28] |
| METR, early 2025 | 16 experienced open-source developers, 246 tasks | Randomized controlled trial | 19% slower with AI | Becker et al. [25] |
| METR, 2026 update | new cohort | Randomized controlled trial | the authors call the new data “an unreliable signal” | METR [26] |
The measured effects range from a 19% slowdown to a 56% speed-up on a toy task. Both factors of the value estimate, the developer count and the productivity multiple, are soft. That weakens the trillion. It also means that any value freed by cheaper coding is not a known number.
3. What the projections assume
Read together, the projections rest on four assumptions. Each is a statement about one direction in the design space, not about the value of software.
- One direction: generation. Every change is written by a model. The value estimate scales productivity by the model, and the cost illustration prices every query [1].
- High energy and high compute. Token volume, data-centre electricity and capex are projected to grow together [8, 10, 11]. The energy per query falls, and the tokens per task rise faster [9, 10].
- Per-token rent. Revenue is billed per token or per seat whose cost is tokens. A developer’s annual token cost is projected at the scale of a salary [1].
- AI in the loop forever. Task 10,000 costs what task 1 costs, because nothing the model learned on task 1 runs without the model on task 10,000.
The essay that states the trillion also states its limit: “while substitution pricing works in early markets, eventually the cost of a good converges to its marginal cost, and so does pricing” [1]. This essay agrees, and asks what the marginal cost of a correct coding task is.
4. What a correct task costs
Define, for one coding task, the outcome of its acceptance check (tests pass, a proof checks, or an output matches a reference), the energy used to reach , in joules, the price of energy, in dollars per joule, and the cost of running the check, in dollars. A buyer pays for , not for tokens.
Energy bounds marginal cost. The marginal cost of a run is at least , since the electricity must be bought. Under competition, price tends toward marginal cost [1, 14].
Much code is reused. Gurevich proved that every sequential algorithm is captured by a sequential abstract state machine: a set of states and a transition rule [35]. Lopes and colleagues measured that about 70% of the code on GitHub consists of clones of previously created files [36]. Where a passing solution already exists, a task can be closed by retrieving and checking it rather than generating it again.
Proposition E0 (price of a covered task). Call a task covered when a stored solution passes its check. Let be the energy to retrieve, apply and check that solution. Under competition among sellers whose results pass the same check, the price of a covered task tends toward
Generation is needed only on uncovered tasks. For a task stream with covered fraction and mean generation cost on uncovered tasks, the expected price per task is . The fraction is not yet measured (Proposition E4).
5. Where the projections are fragile
Per-token pricing. A task closed by reuse needs no tokens, so a revenue line priced per token earns nothing on it. Total token revenue on a task stream scales with .
The model in every loop. If a solution found once is stored and checked, later tasks of the same shape do not need the model, so the model calls per task fall as grows. Whether they do on real work is measured by Proposition E3.
Energy per task. One median text prompt to a production assistant is measured by its operator at 0.24 Wh, or 864 J [12], and the IEA puts reasoning and agentic queries at hundreds or thousands of times the energy of a simple one [10]. No public measurement compares generation and retrieval on the same tasks, so no ratio is stated here.
Two declines multiply. Write the cost per task as , with model calls per task and dollars per call. The price per call at fixed performance falls by a factor of 9 to 900 a year, depending on the task [4, 34]. Reuse lowers . A projection that extrapolates token volume models only .
Bundling. A good whose marginal cost is near zero, and which complements a tool people already have, tends to be bundled into that tool, and its separate price disappears [13, 14]. Nalebuff showed that a bundle can deter entry [32], and Adams and Yellen that it can discriminate on price [33]; Spolsky described the strategy of commoditizing a complement [31]. Pricing changes are visible: GitHub moved Copilot’s individual plans to usage-based billing from 1 June 2026 [30], and Cursor moved Pro from request limits to pass-through API pricing in 2025 [18].
What survives. The value estimate of Section 2.1 can hold. What is fragile is the assumption that the value is collected as a charge on generation, since that charge applies only to the fraction .
6. Demand
Cheaper tasks can raise total demand. The venture essay expects it: “we believe Jevon’s Paradox in this case holds” [1]. Two effects should be separated. Demand for one task stops once . Total use can still grow, because cheaper work opens new tasks. The one published elasticity is small. Across tasks in Anthropic’s API sample, each 1% increase in cost is associated with a 0.29% decrease in usage frequency, an elasticity of [29]. That is cross-sectional across tasks, not a price change over time. With , a price decline on a fixed task set lowers revenue, since revenue changes by .
7. Propositions and protocols
Proposition E1 (the cost curves cross). For a stream of tasks in one repository, the cumulative cost per resolved task of a method that stores and reuses checked solutions falls below that of a method that generates every change, after a finite number of tasks. Protocol: run both on the same issue stream under an external power meter. Report measured_j and dollars per resolved task by task index, and the crossing index.
Proposition E2 (price follows the floor). Where a coding capability can be closed by retrieval and rules, its list price falls toward . Protocol: track list prices of such a capability class against its measured run energy over time.
Proposition E3 (the token share of cost). In a repository where reuse grows, the share of task cost paid as tokens falls. Protocol: log tokens, joules and dollars per closed task by round, and report the token share of cost by round.
Proposition E4 (coverage). The covered fraction of real coding task volume is measurable. Protocol: draw a random sample of merged pull requests from public repositories (GitHub reports 518.7 million merged in a year [17]), test each for a retrieved solution that passes the repository’s tests, and report with a 95% Wilson interval.
References
[1] G. Appenzeller and Y. Li, “The Trillion Dollar AI Software Development Stack,” 9 October 2025. https://a16z.com/the-trillion-dollar-ai-software-development-stack/
[2] Menlo Ventures, “2025: The State of Generative AI in the Enterprise,” December 2025. https://menlovc.com/perspective/2025-the-state-of-generative-ai-in-the-enterprise/
[3] Mordor Intelligence, “AI Code Tools Market Size, Share and 2031 Growth Trends Report,” fetched 11 October 2026. https://www.mordorintelligence.com/industry-reports/artificial-intelligence-code-tools-market
[4] B. Emberson and D. Roodman, “The plunging price of thought,” Epoch AI, 22 September 2026. https://epoch.ai/publications/the-plunging-price-of-thought
[5] Cursor, “Past, Present, and Future” (Series D announcement), 13 November 2025. https://cursor.com/blog/series-d
[6] Anthropic, “Anthropic raises $30 billion in Series G funding at $380 billion post-money valuation,” 12 February 2026. https://www.anthropic.com/news/anthropic-raises-30-billion-series-g-funding-380-billion-post-money-valuation
[7] Microsoft Corporation, Form 10-Q for the quarter ended 30 September 2025, Note 3 and Item 2. https://www.sec.gov/Archives/edgar/data/789019/000119312525256321/msft-20250930.htm
[8] S. Pichai, “I/O 2026: Welcome to the agentic Gemini era,” 19 May 2026. https://blog.google/innovation-and-ai/sundar-pichai-io-2026/
[9] L. Bai, Z. Huang and X. Wang, “How Do AI Agents Spend Your Money? Analyzing and Predicting Token Consumption in Agentic Coding Tasks,” 2026. arXiv:2604.22750. https://arxiv.org/abs/2604.22750
[10] International Energy Agency, Key Questions on Energy and AI, executive summary, 2026. https://www.iea.org/reports/key-questions-on-energy-and-ai/executive-summary
[11] International Energy Agency, Energy and AI, executive summary, April 2025. https://www.iea.org/reports/energy-and-ai/executive-summary
[12] C. Elsworth et al., “Measuring the environmental impact of delivering AI at Google Scale,” 2025. arXiv:2508.15734. https://arxiv.org/abs/2508.15734
[13] Y. Bakos and E. Brynjolfsson, “Bundling Information Goods: Pricing, Profits, and Efficiency,” Management Science 45(12), 1999. doi:10.1287/mnsc.45.12.1613
[14] C. Shapiro and H. R. Varian, Information Rules: A Strategic Guide to the Network Economy, Harvard Business School Press, 1998.
[15] McKinsey & Company, “The economic potential of generative AI: The next productivity frontier,” June 2023. https://www.mckinsey.com/capabilities/tech-and-ai/our-insights/the-economic-potential-of-generative-ai-the-next-productivity-frontier
[16] Goldman Sachs, “Generative AI could raise global GDP by 7%,” April 2023. https://www.goldmansachs.com/intelligence/pages/generative-ai-could-raise-global-gdp-by-7-percent.html
[17] GitHub, “Octoverse: A new developer joins GitHub every second as AI leads TypeScript to #1,” 2025. https://github.blog/news-insights/octoverse/octoverse-a-new-developer-joins-github-every-second-as-ai-leads-typescript-to-1/
[18] Cursor, “Clarifying our pricing,” June 2025 pricing post. https://cursor.com/blog/june-2025-pricing
[19] Microsoft Investor Relations, FY26 Q1 Performance. https://www.microsoft.com/en-us/investor/earnings/fy-2026-q1/performance
[20] G. Appenzeller, “Welcome to LLMflation: LLM inference cost is going down fast,” a16z, November 2024. https://a16z.com/llmflation-llm-inference-cost/
[21] DeepSeek, DeepSeek-V3.2-Exp release and API price reduction, 29 September 2025 (in Chinese). https://api-docs.deepseek.com/zh-cn/news/news250929
[22] OpenAI, “Announcing The Stargate Project,” 21 January 2025. https://openai.com/index/announcing-the-stargate-project/
[23] D. Cahn, “AI’s $600B Question,” Sequoia Capital, 2024. https://www.sequoiacap.com/article/ais-600b-question/
[24] Gartner, “Gartner Says Worldwide AI Spending Will Total $1.5 Trillion in 2025,” 17 September 2025. https://www.gartner.com/en/newsroom/press-releases/2025-09-17-gartner-says-worldwide-ai-spending-will-total-1-point-5-trillion-in-2025
[25] J. Becker, N. Rush, E. Barnes and D. Rein, “Measuring the Impact of Early-2025 AI on Experienced Open-Source Developer Productivity,” METR, 2025. arXiv:2507.09089. https://arxiv.org/abs/2507.09089
[26] METR, uplift study update, 24 February 2026. https://metr.org/blog/2026-02-24-uplift-update/
[27] S. Peng, E. Kalliamvakou, P. Cihon and M. Demirer, “The Impact of AI on Developer Productivity: Evidence from GitHub Copilot,” 2023. arXiv:2302.06590. https://arxiv.org/abs/2302.06590
[28] E. Paradis, K. Grey, Q. Madison et al., “How much does AI impact development speed? An enterprise-based randomized controlled trial,” 2024. arXiv:2410.12944. https://arxiv.org/abs/2410.12944
[29] Anthropic, “Anthropic Economic Index report: Uneven geographic and enterprise AI adoption,” September 2025. https://www.anthropic.com/research/anthropic-economic-index-september-2025-report
[30] GitHub Japan blog, “GitHub Copilotの個人向けプラン: ProとPro+へのフレックス枠追加と新しいMaxプランのご紹介,” 15 May 2026 (in Japanese). https://github.blog/jp/2026-05-15-github-copilot-individual-plans-introducing-flex-allotments-in-pro-and-pro-and-a-new-max-plan/
[31] J. Spolsky, “Strategy Letter V,” Joel on Software, 12 June 2002. https://www.joelonsoftware.com/2002/06/12/strategy-letter-v/
[32] B. Nalebuff, “Bundling as an Entry Barrier,” Quarterly Journal of Economics 119(1), 2004. doi:10.1162/003355304772839551
[33] W. J. Adams and J. L. Yellen, “Commodity Bundling and the Burden of Monopoly,” Quarterly Journal of Economics 90(3), 1976. doi:10.2307/1886045
[34] Epoch AI, “LLM inference prices have fallen rapidly but unequally across tasks,” data insight. https://epoch.ai/data-insights/llm-inference-price-trends
[35] Y. Gurevich, “Sequential abstract-state machines capture sequential algorithms,” ACM Transactions on Computational Logic 1(1), 2000, pp. 77 to 111. doi:10.1145/343369.343384
[36] C. V. Lopes, P. Maj, P. Martins, V. Saini, D. Yang, J. Zitny, H. Sajnani and J. Vitek, “DéjàVu: a map of code duplicates on GitHub,” Proceedings of the ACM on Programming Languages 1(OOPSLA), 2017, article 84. doi:10.1145/3133908