The Price of the Unexamined Interface
What interface failures cost, using only figures a primary source states, each labeled as an accounted cost, a model estimate or a survey estimate.
David Charlot, Open Interface Engineering
Research studies, not journal finals. Notation is defined in the paper. Analytical energy estimates are not board power. Interactive figures live under /living/. Shared terms: glossary.
Cite this
Genre: Economics essay
David Charlot, Open Interface Engineering. The Price of the Unexamined Interface. Open Interface Engineering. Web: https://research.openie.dev/papers/interface-economics/. PDF: https://research.openie.dev/pdfs/interface-economics.pdf.
The Price of the Unexamined Interface
Version 1.0, 11 October 2026. LaTeX PDF: /pdfs/latex/interface-economics.pdf (source).
Abstract
This essay collects the published costs of failures that happen at the handoffs between parts of a system, and labels each figure by how it was produced. It does not add them into one total.
In plain words
- Some failures at handoffs have exact price tags, like a lost Mars probe that cost hundreds of millions of dollars.
- The bigger national numbers are estimates from surveys and models, and none of them counts handoff failures alone.
- Writing down and checking what each side assumes is cheap, but the person who does it pays while everyone benefits, so it tends not to get done.
0. Definitions and scope
An interface is a handoff across which one party’s output becomes another party’s input: from the people who state what a system should do (theorists), to those who build it (makers), to those who run it (users), or between two levels of a software and hardware stack. An interface assumption is a condition on the values that cross a handoff which the receiving side relies on for its own correctness, such as a unit, a range, a type, a version or an operating envelope. An assumption is unexamined when it is relied on but neither written down nor checked. A long engineering literature, from Garlan, Allen and Ockerbloom on architectural mismatch to Leveson on accidents as interaction failures, locates many system failures at such assumptions [19, 20]. This essay asks what those failures cost, and answers only with figures that a primary source states. Each figure is labeled by kind. An accounted cost is what an agency or firm reports it actually spent or lost. A model estimate is a figure produced by a stated method from surveys, interviews or secondary data. A projection is a statement about the future. The three kinds are not added together.
The accounted costs of single interface failures are large and specific: the Mars Surveyor 1998 project, which included Mars Climate Orbiter, cost $327.6 million [1], and ESA approved 214 million ECU to recover the Cluster mission lost on the first Ariane 5 [4]. The model estimates are larger and broader: NIST put the annual cost of an inadequate software testing infrastructure in the United States at $59.5 billion [6], and the cost of inadequate interoperability in the US capital facilities industry at $15.8 billion a year [7]. CISQ estimated the cost of poor software quality in the United States at no less than $2.41 trillion in 2022 and accumulated technical debt at about $1.52 trillion [8]. None of these measures interface failure alone. Each contains it.
1. Kinds of number
Economic claims about software failure travel in three forms that look alike and are not. A project budget is an accounting record. A national cost estimate is the output of a model whose inputs are surveys, case studies and assumptions about scale. A forecast is neither. This essay follows one rule: every figure carries its kind, its source and what it actually counts.
Figures for the cost of “interface failure” as a single annual total circulate without a stated method. None of the primary estimates in Section 3 isolates interfaces, so this essay does not map them onto any single total.
2. Single failures, accounted
Mars Climate Orbiter. The interface was a unit: thruster impulse data in pound-force seconds read as newton seconds [2]. NASA’s project fact sheet gives the cost of the Mars Surveyor 1998 project as $327.6 million for the orbiter and the Mars Polar Lander together: $193.1 million for spacecraft development, $91.7 million for launch and $42.8 million for operations [1]. Contemporary reports gave the orbiter alone as a $125 million spacecraft [3]. Kind: accounted cost of the project, with a reported figure for the one spacecraft.
Ariane 501 and Cluster. The interface was an envelope: software reused from Ariane 4 assumed a range of horizontal velocity that the new launcher exceeded [5]. The four Cluster satellites were lost. ESA’s account of the recovery records the options its Science Programme Committee priced in 1996, including 351 million accounting units to rebuild the four satellites to the original design, and ESA approved a recovery mission, Cluster II, for 214 million ECU in 1997 [4, 17]. Kind: accounted cost of the recovery that ESA chose, which is a lower bound on the loss, not the value of the satellites or of the delayed science.
These two cases fix the shape of the problem. In each, every body did its own work, and the cost landed at the interface. In each, the check that would have caught the mismatch was cheap relative to the loss. Neither case can be scaled up to a national figure, because single accidents are not a sample.
3. National estimates, modeled
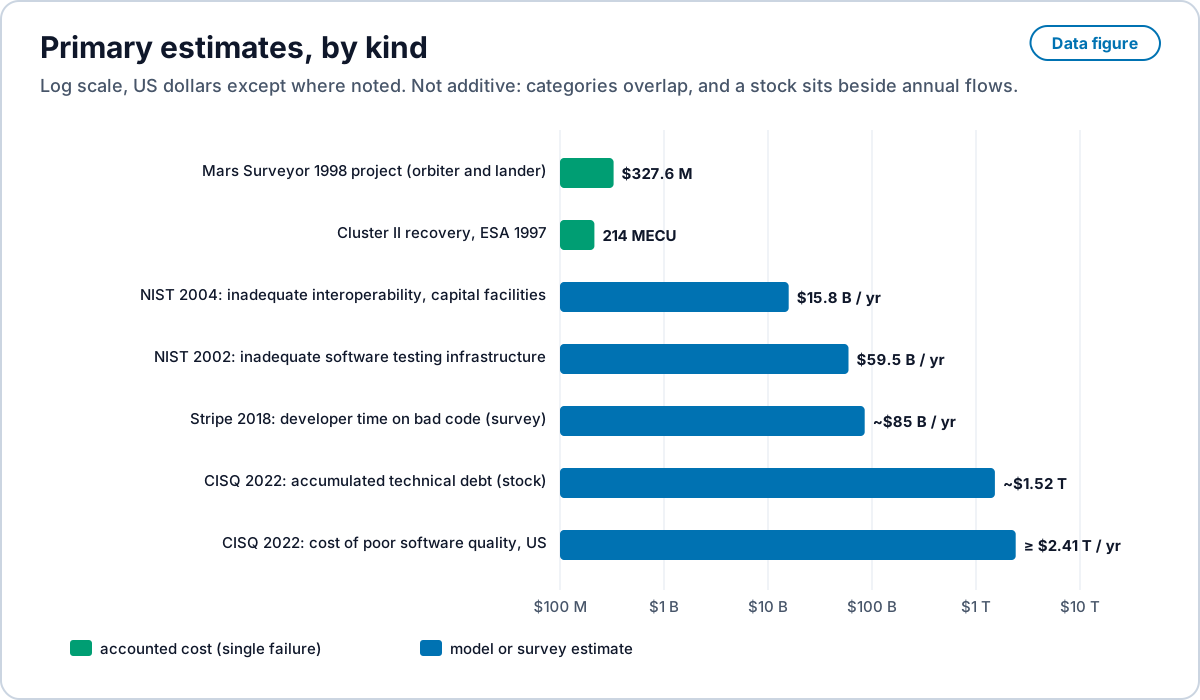
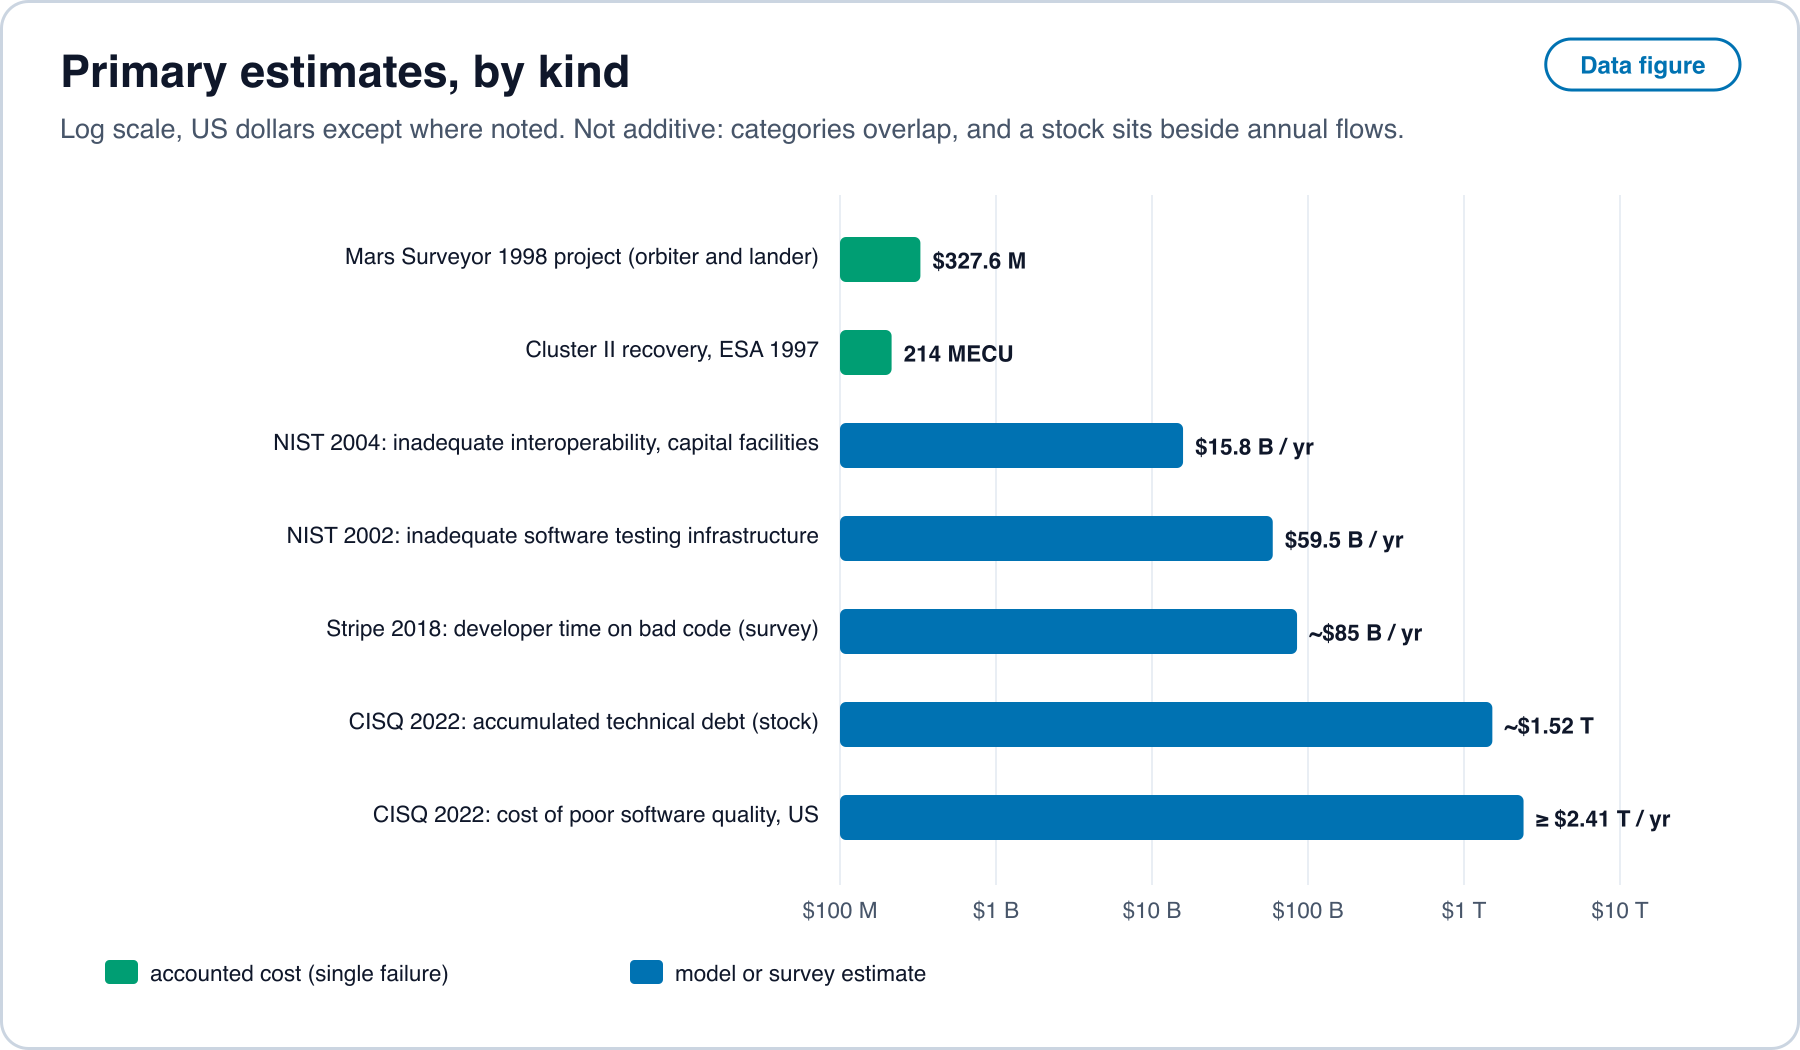
Software testing, NIST 2002. RTI International, for NIST, estimated that an inadequate infrastructure for software testing cost the US economy $22.2 billion to $59.5 billion a year, with the upper figure as the total cost and the lower figure as the part that feasible improvements could remove [6]. The method combined surveys of developers and users in two sectors, transportation manufacturing and financial services, with an extrapolation to the national economy. Kind: model estimate.
Interoperability, NIST 2004. Gallaher and colleagues, for NIST, estimated the cost of inadequate interoperability in the US capital facilities industry at $15.8 billion a year, from interviews and surveys of owners, operators, architects, engineers and contractors [7]. Interoperability here is the ability to exchange and use design and operating data across software systems, which is an interface in the sense defined in the Abstract. The report states that its figure omits costs it could not quantify. Kind: model estimate, one industry, presented as conservative.
Poor software quality, CISQ 2022. The Consortium for Information and Software Quality estimated that the cost of poor software quality in the United States had grown to at least $2.41 trillion in 2022, and that accumulated technical debt had grown to about $1.52 trillion [8]. The report builds the total from categories, operational failures, unsuccessful projects, legacy system problems and cybercrime losses attributed to software vulnerabilities, and draws much of its input from secondary sources; its cybercrime component apportions a global forecast to the United States [8]. Kind: model estimate built partly on other estimates. It is the largest documented figure in this area, and it is a figure for software quality as a whole, not for interfaces.
Developer time, Stripe 2018. A Stripe survey conducted with Harris Poll reported that developers spend about 17.3 hours a week on maintenance work such as debugging and refactoring, and about four hours a week on “bad code,” which the report values at nearly $85 billion a year worldwide [9]. Kind: survey-based estimate.
What these figures share is a structure, not a total. Each counts the cost of an assumption that was relied on and not checked: an untested path, a data format that does not carry across, a vulnerability at a boundary, a legacy system whose contracts no one can restate. A mismatch that is not checked where it arises passes as well-formed input to every level above it, so its cost appears far from its cause, as in the Mars Climate Orbiter navigation solution, which was internally consistent and wrong [2]. That is also why national estimates must be modeled rather than counted.
4. Technical debt is an interface account
Cunningham introduced technical debt in 1992 as the cost of shipping code whose structure does not yet match what the team has learned, with interest paid on every later change until the debt is repaid [10]. Sculley and colleagues showed that in machine learning systems most of that debt sits outside the model, in glue code, configuration, data dependencies and undeclared consumers [11]. In the terms defined above, much of technical debt is a balance of unexamined interface assumptions carried on the books, and its interest is the cost an unchecked mismatch charges every level above it, on every run.
CISQ’s estimate of about $1.52 trillion of accumulated technical debt in the United States is a stock, measured in the cost to fix [8]. The annual figures in Section 3 are flows. The economic consequence is a hypothesis, tested in Section 7: a check paid once at a boundary may cost less over a workload than a failure paid again at every level it reaches.
5. Standards are how markets close interfaces
Economists have studied the interface problem for decades under another name: compatibility. Katz and Shapiro showed that when a product’s value rises with the number of users it can work with, firms’ incentives to be compatible depend on their size and position, and the market can deliver too little compatibility [12]. Farrell and Saloner showed that a market can stay stuck on an old standard, or move to a new one too fast, because each user’s choice depends on what others choose [13]. David’s history of the QWERTY keyboard made path dependence concrete [14]. Baldwin and Clark showed that design rules, visible interfaces fixed in advance, are what let modular industries form at all [15]. Swann’s review for the UK government summarized evidence that standards contribute to productivity and trade [16].
The common thread is that an interface is a public good with private costs. Writing an assumption down and checking it benefits every party that crosses the boundary, but it is paid for by whoever does the writing. Each party has a reason to treat the handoff as someone else’s job. Standards bodies, regulators and platform owners are the institutions that have historically paid that cost. Machine-checked representations, such as types that carry units of measure or formal specifications checked by a model checker [21, 22], lower the private cost of closing an interface toward the cost of running its check.
6. Generated code crosses the same interfaces
Code produced by an automated generator crosses the same boundaries as hand-written code: between a specification and an implementation, between a library and its users, between software and the instruction contract beneath it. Each crossing carries assumptions that a generator does not check unless it is built to. The figures in Section 3 therefore bear on automated code generation too. If a large share of the cost of poor software quality is the cost of unchecked assumptions at boundaries, then the value of closing interfaces may exceed the value of writing code faster. That is a hypothesis about where value lies, not a measurement. The protocols in Section 7 are the way to measure it.
7. Propositions and protocols
Proposition E1 (the interface share). In a population of software failures with accounted costs, the share of cost whose cause is a violated interface assumption, as defined in the Abstract, exceeds the share whose cause lies wholly inside one body.
Protocol. Take a public incident corpus with cost fields, such as agency mishap reports or regulatory filings. Two coders classify each cause as interface or internal using the definitions in the Abstract, blind to cost. Report the cost-weighted interface share with a bootstrap interval and the coders’ agreement.
Proposition E2 (checks pay). For a fixed workload, the cost of adding an explicit check at an interface is lower than the expected cost of the failures it refuses, summed over every level the failure would otherwise reach. Formally, for an interface crossed times, let be the cost of one check in dollars, the probability that a crossing violates the assumption, and the cost in dollars that an uncaught violation imposes at level of the levels it reaches. The check pays when , that is, when . The two accounted cases of Section 2 have of order dollars, so the condition holds for any check costing less than dollars per crossing.
Protocol. On a system whose levels have known operating costs, inject a violation of each recorded interface assumption on a fixed seed set, recording the cost of each check and the cost of each uncaught violation where it lands. Report both in joules and in dollars at a stated price.
Proposition E3 (closing an interface lowers its private cost). When the interface assumption is part of a shared representation and checked by construction, the cost to a single party of closing it falls toward the cost of running the check.
Protocol. Choose a real handoff between organizations, such as a specification passed to an implementer. Carry it in one arm as prose documentation and in the other as a machine-checked representation. Record labor hours on each side of the handoff and the failures located at the interface in each arm, with Wilson 95% intervals.
8. Conclusion
The cost of unexamined interfaces is real, large and badly measured. Single failures can be priced exactly, and they show that the loss lands at a boundary every body thought belonged to someone else. National estimates are models, and the largest of them describe software quality as a whole. No primary source states the cost of interface failure by itself, and this essay does not supply one. What the evidence supports is a structure: costs that arise at boundaries, propagate upward and compound as debt, in markets that underprovide the public good of a checked interface. The propositions of Section 7 state how that structure can be tested.
References
[1] NASA Jet Propulsion Laboratory, “Mars Climate Orbiter Fact Sheet,” Mars Surveyor 1998 project. Archived copy: https://web.archive.org/web/20121003073752/http://mars.jpl.nasa.gov/msp98/orbiter/fact.html
[2] Mars Climate Orbiter Mishap Investigation Board, Phase I Report. NASA, 10 November 1999. https://llis.nasa.gov/llis_lib/pdf/1009464main1_0641-mr.pdf
[3] A. Pollack, “Two Teams, Two Measures Equaled One Lost Spacecraft,” The New York Times, 1 October 1999. https://archive.nytimes.com/www.nytimes.com/library/national/science/100199sci-nasa-mars.html
[4] European Space Agency, “Cluster will fly again!,” press release N° 12 1997, 26 March 1997. https://www.esa.int/Newsroom/Press_Releases/Cluster_will_fly_again
[5] J. L. Lions (chair), Ariane 5 Flight 501 Failure: Report by the Inquiry Board. European Space Agency, 19 July 1996. https://esamultimedia.esa.int/docs/esa-x-1819eng.pdf
[6] RTI International for the National Institute of Standards and Technology, The Economic Impacts of Inadequate Infrastructure for Software Testing, Planning Report 02-3, May 2002. https://www.nist.gov/system/files/documents/director/planning/report02-3.pdf
[7] M. P. Gallaher, A. C. O’Connor, J. L. Dettbarn and L. T. Gilday, Cost Analysis of Inadequate Interoperability in the U.S. Capital Facilities Industry, NIST GCR 04-867, 2004. doi:10.6028/NIST.GCR.04-867
[8] H. Krasner, The Cost of Poor Software Quality in the US: A 2022 Report. Consortium for Information and Software Quality, 2022. https://www.it-cisq.org/the-cost-of-poor-quality-software-in-the-us-a-2022-report/
[9] Stripe, The Developer Coefficient, with Harris Poll, September 2018. https://stripe.com/files/reports/the-developer-coefficient.pdf
[10] W. Cunningham, “The WyCash portfolio management system,” OOPSLA 1992 Addendum, ACM SIGPLAN OOPS Messenger 4(2), 1993, pp. 29 to 30. doi:10.1145/157710.157715
[11] D. Sculley, G. Holt, D. Golovin, E. Davydov, T. Phillips, D. Ebner, V. Chaudhary, M. Young, J.-F. Crespo and D. Dennison, “Hidden Technical Debt in Machine Learning Systems,” Advances in Neural Information Processing Systems 28, 2015. https://papers.nips.cc/paper_files/paper/2015/hash/86df7dcfd896fcaf2674f757a2463eba-Abstract.html
[12] M. L. Katz and C. Shapiro, “Network Externalities, Competition, and Compatibility,” American Economic Review 75(3), June 1985, pp. 424 to 440. RePEc:aea:aecrev:v:75:y:1985:i:3:p:424-40. https://www.jstor.org/stable/1814809
[13] J. Farrell and G. Saloner, “Standardization, Compatibility, and Innovation,” RAND Journal of Economics 16(1), 1985, pp. 70 to 83. doi:10.2307/2555589
[14] P. A. David, “Clio and the Economics of QWERTY,” American Economic Review 75(2), Papers and Proceedings, May 1985, pp. 332 to 337. RePEc:aea:aecrev:v:75:y:1985:i:2:p:332-37. https://www.jstor.org/stable/1805621
[15] C. Y. Baldwin and K. B. Clark, Design Rules, Volume 1: The Power of Modularity. MIT Press, 2000. doi:10.7551/mitpress/2366.001.0001
[16] G. M. P. Swann, The Economics of Standardization: An Update. Report for the UK Department for Business, Innovation and Skills, 2010. https://www.gov.uk/government/publications/economics-of-standardisation-update-to-report
[17] European Space Agency, “The Resurrection of the Cluster Scientific Mission,” ESA Bulletin 91, 1997. https://www.esa.int/esapub/bulletin/bullet91/b91cred.htm
[19] D. Garlan, R. Allen and J. Ockerbloom, “Architectural mismatch: why reuse is so hard,” IEEE Software 12(6), 1995, pp. 17 to 26. doi:10.1109/52.469757
[20] N. G. Leveson, Engineering a Safer World: Systems Thinking Applied to Safety. MIT Press, 2012. doi:10.7551/mitpress/8179.001.0001
[21] A. Kennedy, “Types for Units-of-Measure: Theory and Practice,” in Central European Functional Programming School, Lecture Notes in Computer Science 6299, Springer, 2010, pp. 268 to 305. doi:10.1007/978-3-642-17685-2_8
[22] C. Newcombe, T. Rath, F. Zhang, B. Munteanu, M. Brooker and M. Deardeuff, “How Amazon Web Services uses formal methods,” Communications of the ACM 58(4), 2015, pp. 66 to 73. doi:10.1145/2699417